SocialPeta-[Advertiser Analysis] & [Top Charts] revised!

Paying attention to the pain points and needs of user application scenarios, the majority of customers continue to launch new feature highlights in response to customer needs and continue to improve product-related functions through continuous function iterations.
From April to May, the Socialpeta of the new version of [Advertiser Analysis] and [Top Charts] were launched. Then, what new features are updated in the new version and what user experience is improved, let me explain to you one by one.
- What are the changes in Advertiser analysis?
- What has changed in the Top charts?
- What can these new features bring me?
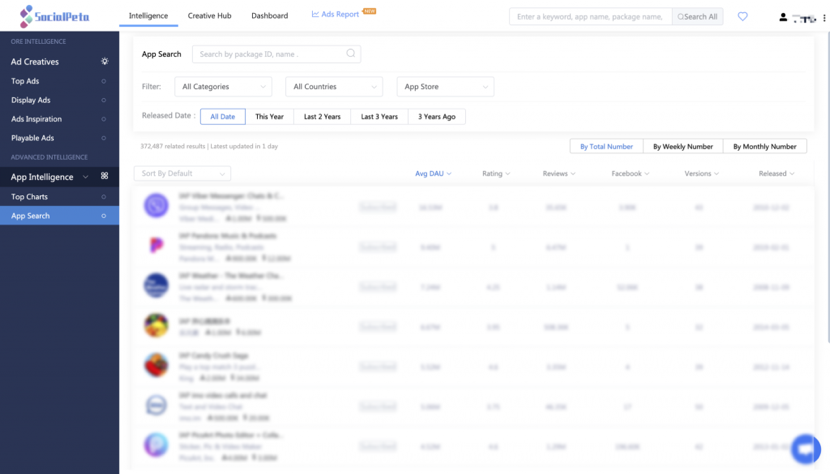
What are the changes in the new advertiser analysis?
- Clearer analysis function distribution
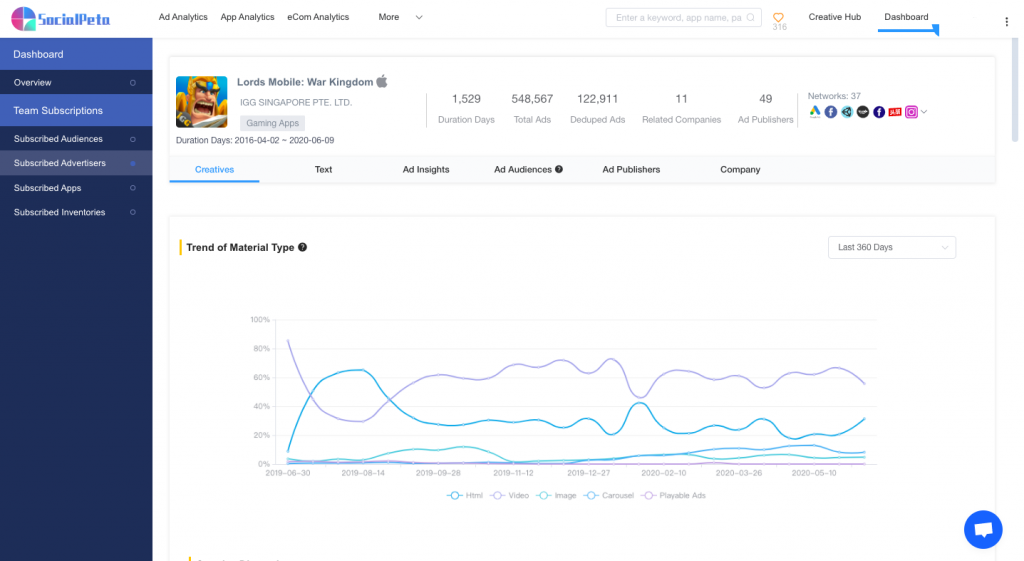
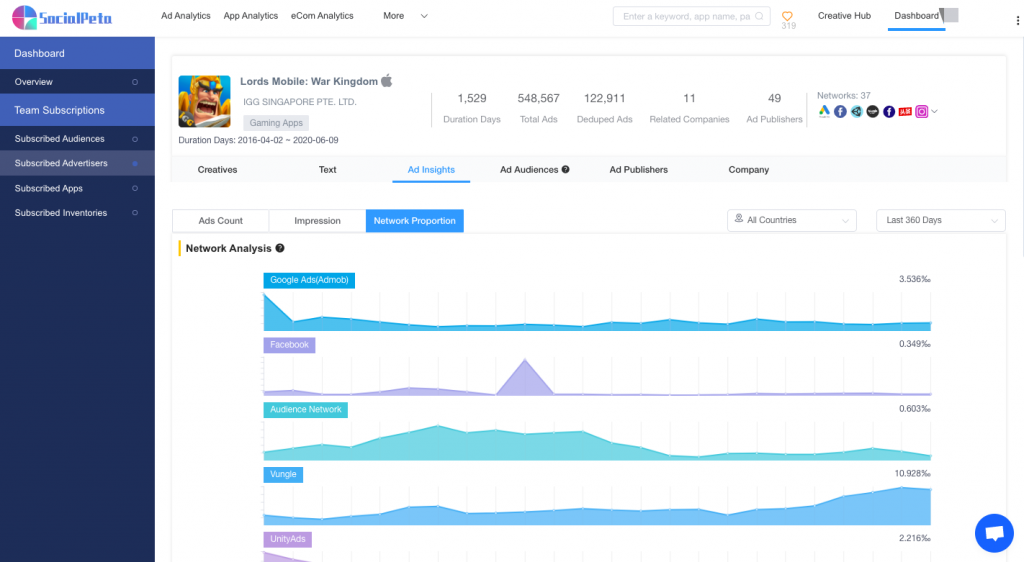
According to the different functional dimensions, we re-planned the analysis of advertisers into six sections : Creatives, Text, Ad insights, Ad audiences, Ad publishers and company . The functions are more focused and easy to see. Users can view the competition dimensions of different advertisers in a more focused manner at different stages of advertising operation.
- Brand new chart display
We have updated the display of the data table, which is clearer than the previous data display, the data of different dimensions are more contrasted, and it is more convenient to browse the data trends.
- New creative material distribution , size distribution
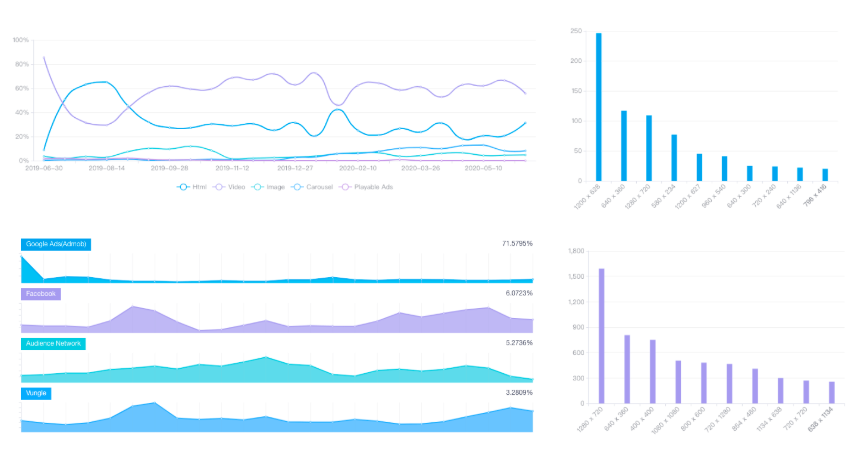
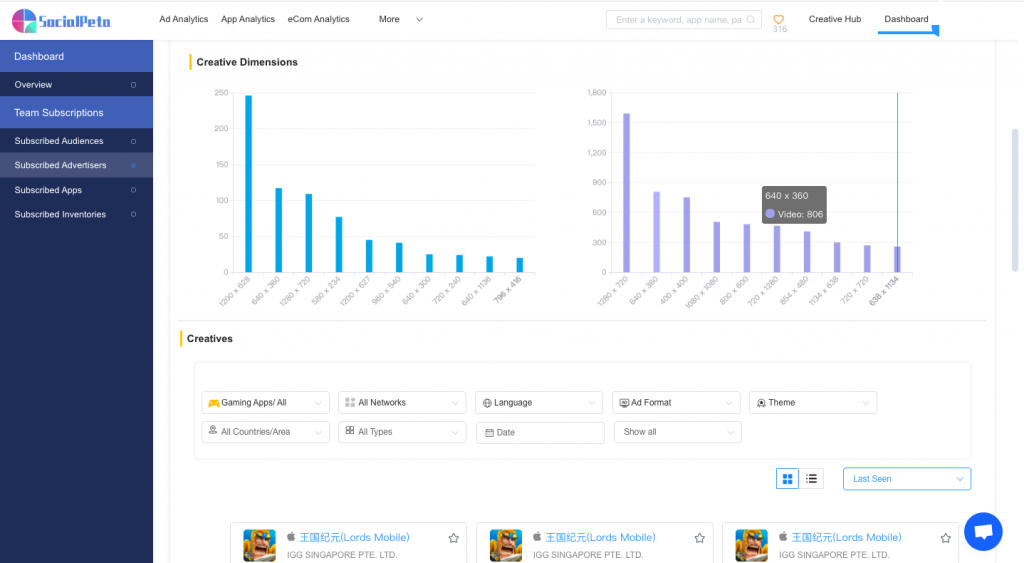
Increase the types of creatives that advertisers put in: pictures, carousels, videos, HTML, and playable ads . The distribution changes to help you understand competitors’ design trends.
Increasing the proportion of specifications of different sizes of competitive advertisers , we can calculate from the public which ad layouts dominated by competitors and which material format is most commonly used for display.
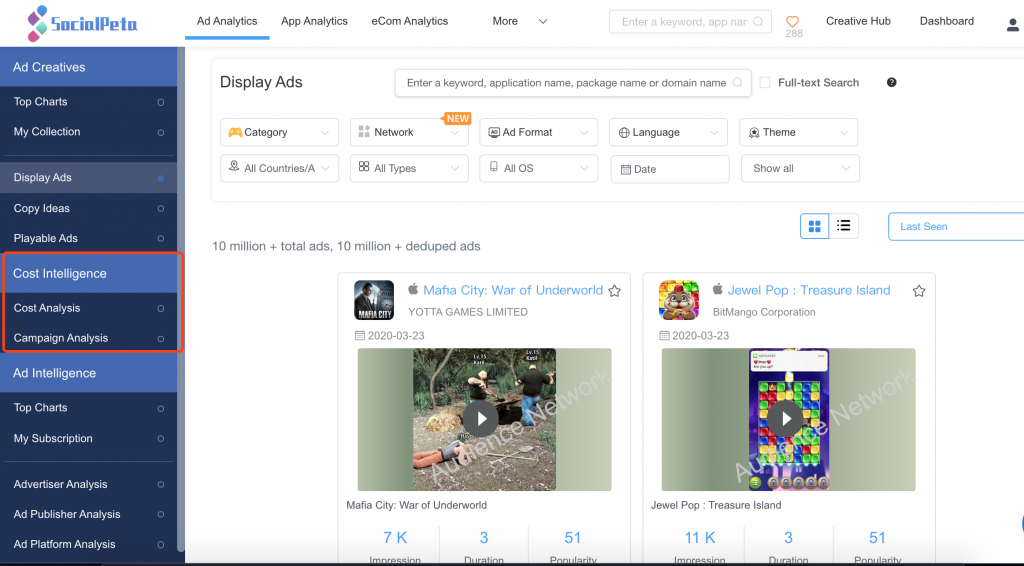
- More sophisticated campaign analysis shows
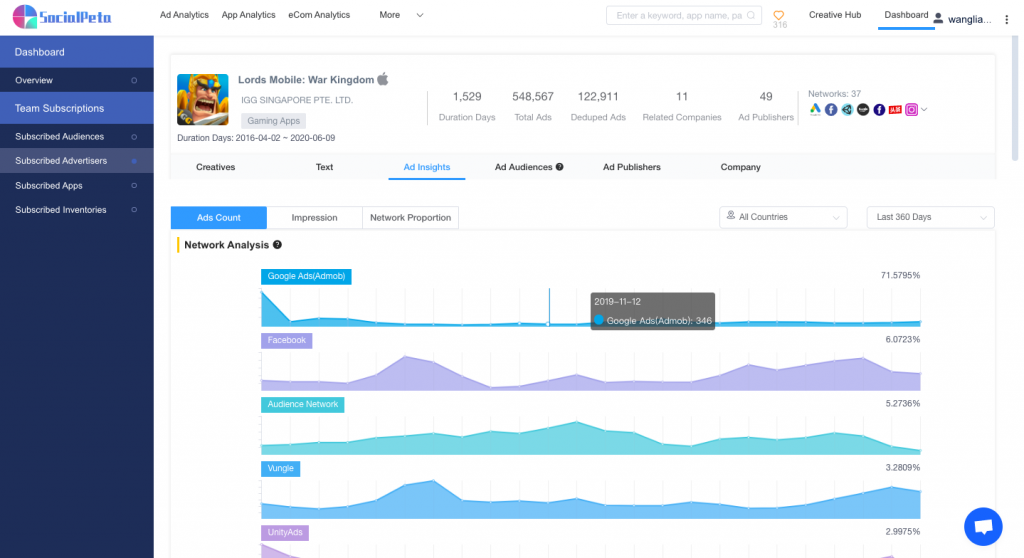
We divide the delivery into three perspectives : “creatives” , “Impression” and ” networks” . The total number of creatives reflects the proportion of creative delivery by the current advertiser in different channels under the selected conditions; the display estimate reflects the current advertiser’s Proportion of display volume; The proportion of channel placement indicates that the current advertisers display the proportion of the total amount of advertisements displayed on the current network .
What are the changes in the new Top Charts?
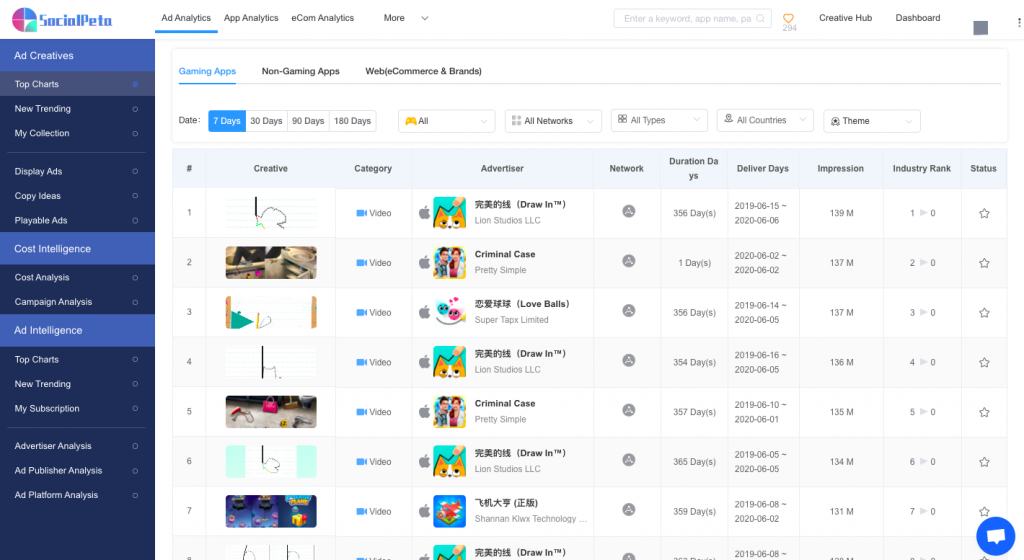
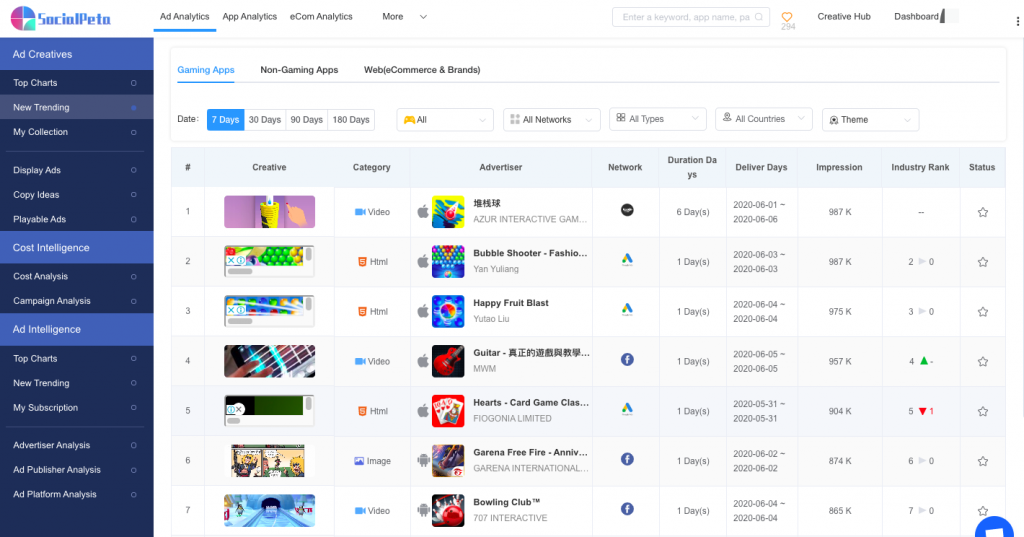
- New UX experience
In April 2020, we revised the advertiser list and creative list. Optimized the filtering experience, table display and other details, the overall page design is more clear and clear, carefully polished every detail, hoping to provide a more friendly user experience.
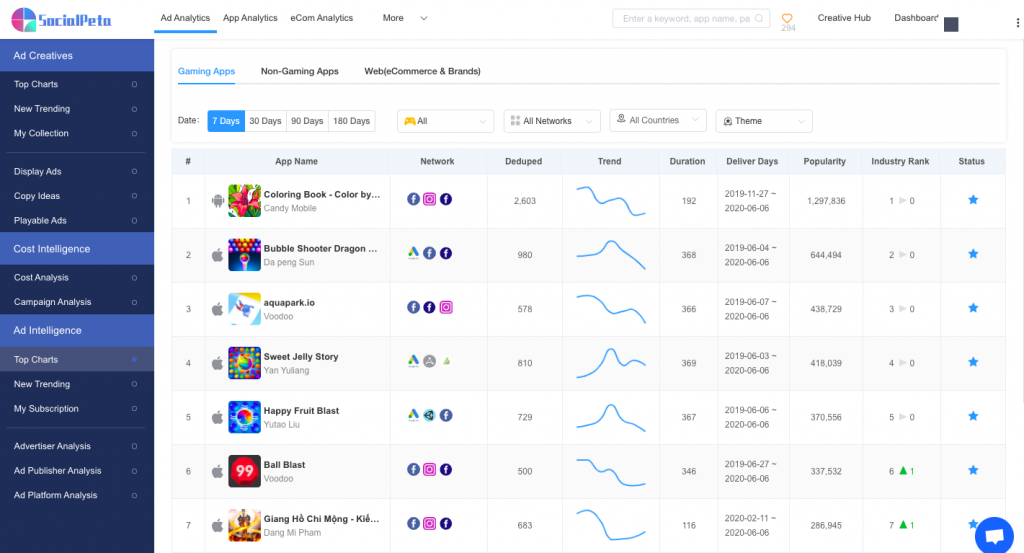
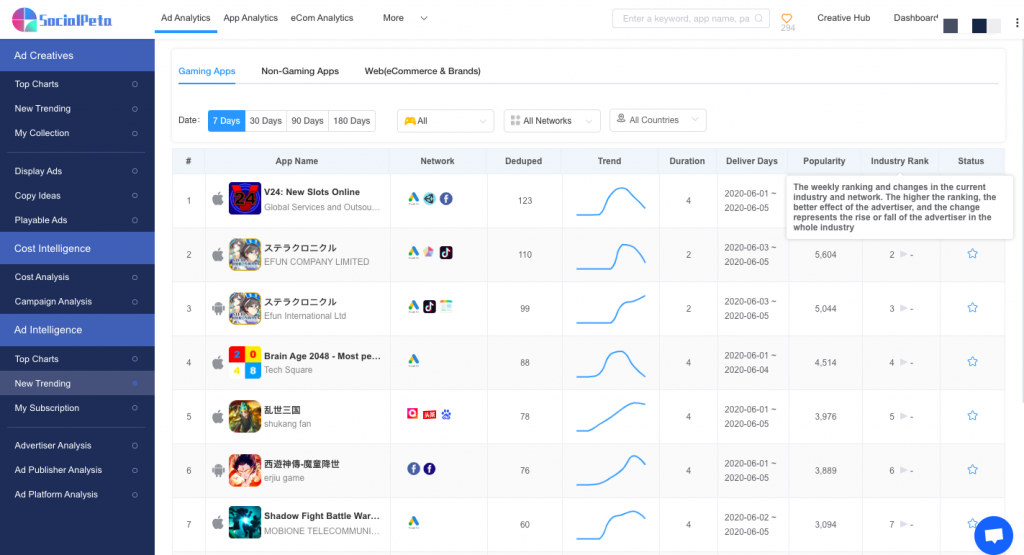
- More accurate list classification
According to users’ attention to new product list and giant list. SocialPeta have simplified the previous list into two dimensions: giants and new products. The giant list aims to focus on the high-impact competitors already in the market, and the new product list helps to gain insight into the market’s new budding advertising favorites.
Both the total list and the new product list are divided into three industry lists: games, tools, and e-commerce, which are more focused and easier to see than the previous lists. With the addition of e-commerce features, we have increased the list of new products for e-commerce advertisers to help customers in the e-commerce industry gain a better insight into competitive products in the industry.

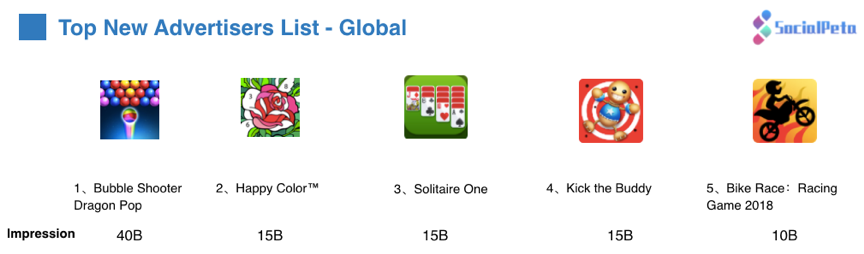
- Visual “trend” data metrics and ranking insights
In the list of advertisers, we have added a new “trend” change indicator, the recent changes in the trends of advertisers are unobstructed. While focusing on rankings, the rate of rise in rankings is also a key indicator that cannot be underestimated. Not only do we rank advertisers and ideas by industry in each period, but we also record the up / down dynamics of the advertisers, breaking the ranking Plane observation.
What can these new features bring me?
- View competitors’ delivery strategies
Delivery optimization is too long and too cumbersome, so much information does not know to take care of that? The new advertiser correspondence creative production → → copywriting marketing campaign set range → → refined audience flow expansion of the ad serving process, you can view the targeted analysis of competitors compete in the different modules corresponding to the target stages, saving you time, let Your work is more focused.
- Forecast ad progress
Can KPIs be achieved through such distribution? The AB test takes time and budget. How can I quickly optimize my advertising strategy? Advertiser analysis placement analysis helps you speculate on the quality of placement strategies based on the strategies and market share of similarly competitive advertisers. Allows you to save more testing costs and quickly reach the ideal state.
- Pay attention to the dynamic changes in the industry market
Advertisers are too broad. What should I do if I continue to analyze the market rankings? The new version of the advertiser list divides the list into three sub-lists of games, tools, and e-commerce. Every time you enter the broad list, you can view the competitive ranking of the giant advertisers in the current industry of interest. At the same time, the advertising curve of advertisers under different time periods has also been added. It is clear at a glance when the giant advertisers concerned will launch. The newly added industry rankings and ascending / descending changes can also understand the dynamic evaluation of the current advertisers ’delivery performance.
- Identify new competitors in time
With the explosion of information on the Internet and continuous marketing, which advertisers should be followed in time? The ranking of new product advertisers helps you understand the new budding competitors in all walks of life in a time dimension such as a week / January by ranking the popularity value. Don’t miss every hotspot business opportunity.
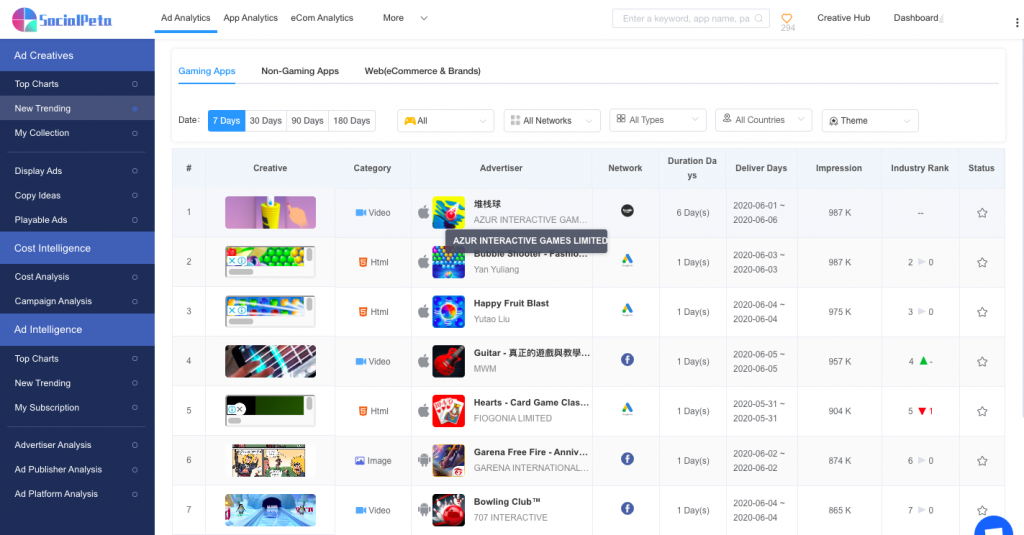
- Reference excellent market ideas
In the end, what high-quality ideas can stand the test of the market? The new creative list helps you quickly see which outstanding ideas have stood the test of the market, help you sum up market laws, and check for gaps.
- Follow popular creatives
Unpredictable market changes, what new ways can attract users to click and improve conversion? The new creative list helps you to check the latest hot ideas in time. According to the latest popular advertisements in different time, different channels and different categories, you can also pay attention to the change of ranking of the creative and not miss every business opportunity.
to sum up
I hope the new features of Advertiser analysis and Top charts will provide a more powerful reference for your advertising business growth and inspire your fresh inspiration. We will also continue to improve our products to provide you with more powerful functions.
You are welcome to contact our business to open a purchase, you are welcome to ask any questions!