SocialPeta-Amazon Rearch-Market Insight Update

SocialPeta has recently updated the Market Insight feature, which you can use in ‘Global eCom Analytics-Amazon Research-Market Insight-Click on a specific category’
- Add ‘Competitive Analysis‘ function
- Optimized details such as chart display and annotations
Function Introduction:Competitive Analysis
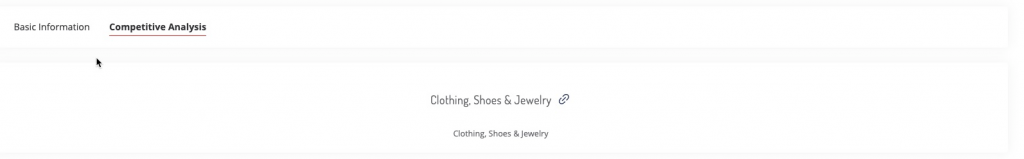
1. Basic Info
You can click on the Amazon link to jump to the Amazon BSR ranking page; you can click on the category path in the category link to view the details of the corresponding category.
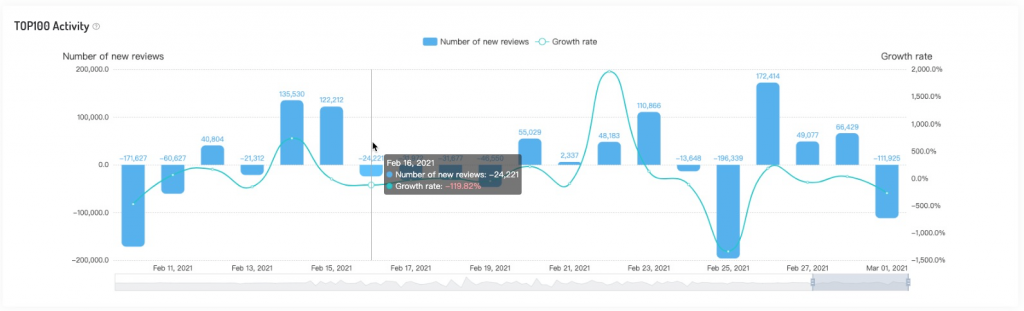
2. Top100 Activity
Show the relationship between the number of new comments and the rate of change of the top 100 products in the category BSR, through the comment change can determine the category’s active situation, the greater the comment change the more active the category.
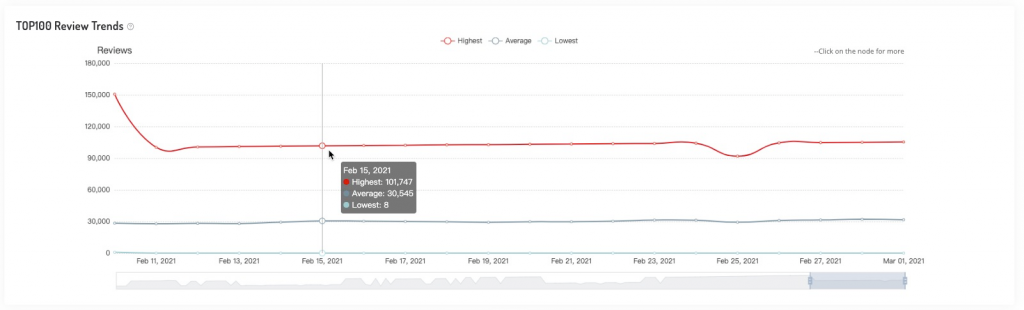
3. Top100 Review Trends
Show the historical review trends of the top 100 products in the category BSR, so you can judge the future trend of the single product in the category and the difficulty of entering the category BSR Top100.
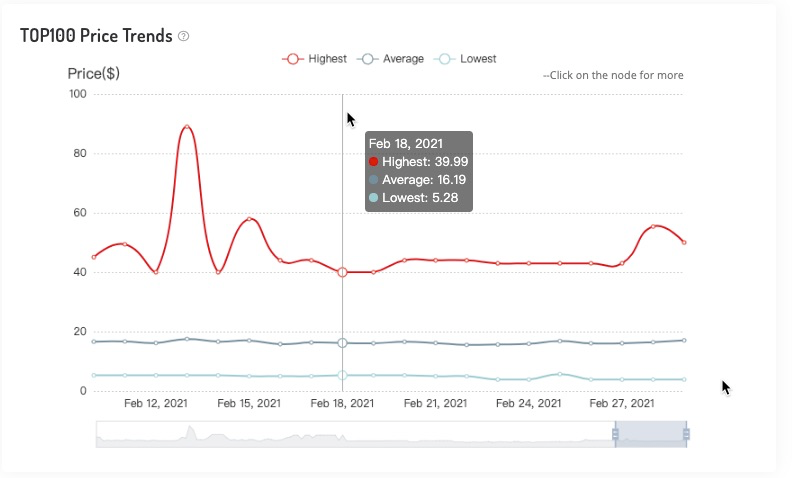
4. Top100 Price Trends
Display the price trends of the top 100 products in the category BSR, to understand the price situation of the category and provide a basis for their own product pricing.
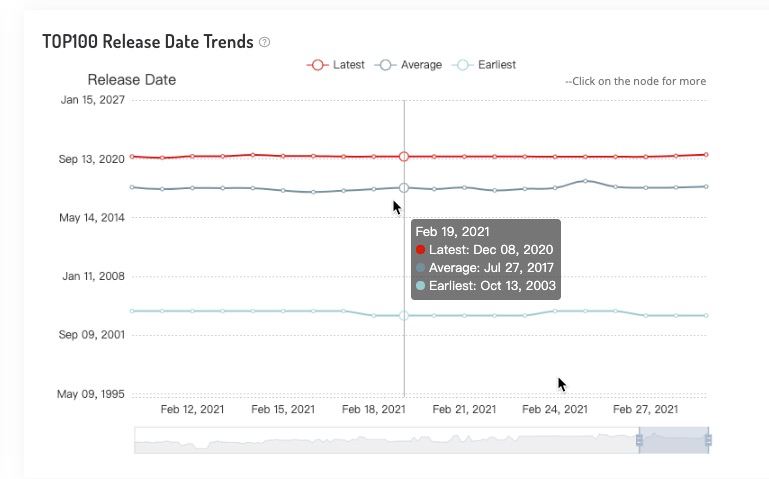
5. Top100 Realease Date Trends
Show the top 100 products in the category BSR realease date trends, used to analyze the new trend of the category.
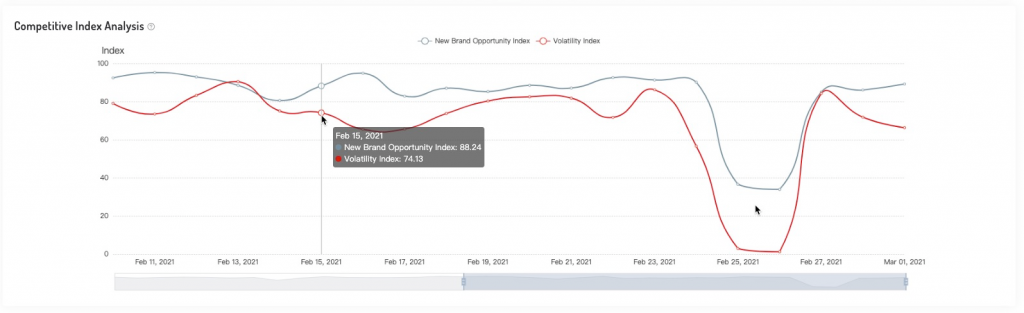
6. Competition Index Analysis
The new brand opportunity index and volatility index are used to analyze the degree of competition in the category and thus determine the development potential of the product under the category.
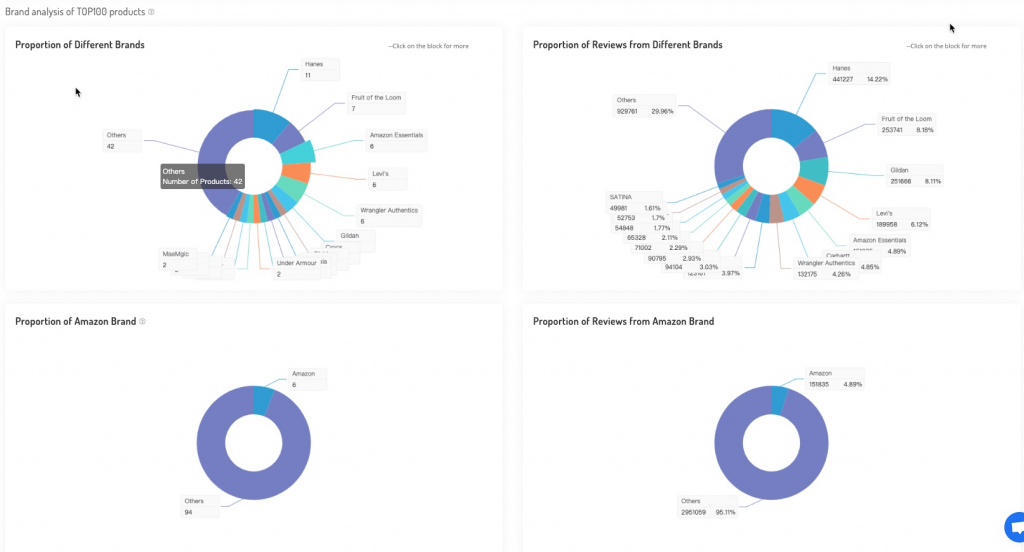
7. Brand Analysis of TOP100 Products
From the product share, review share, Amazon product share, Amazon review share, these four aspects to analyze; the more scattered brand distribution, indicating that the category more fierce competition; if the category brand more concentrated indicates that the brand effect is obvious, not conducive to new entry; on the other hand, the less Amazon products in the head brand share, indicating that the greater the opportunity for third-party brands.
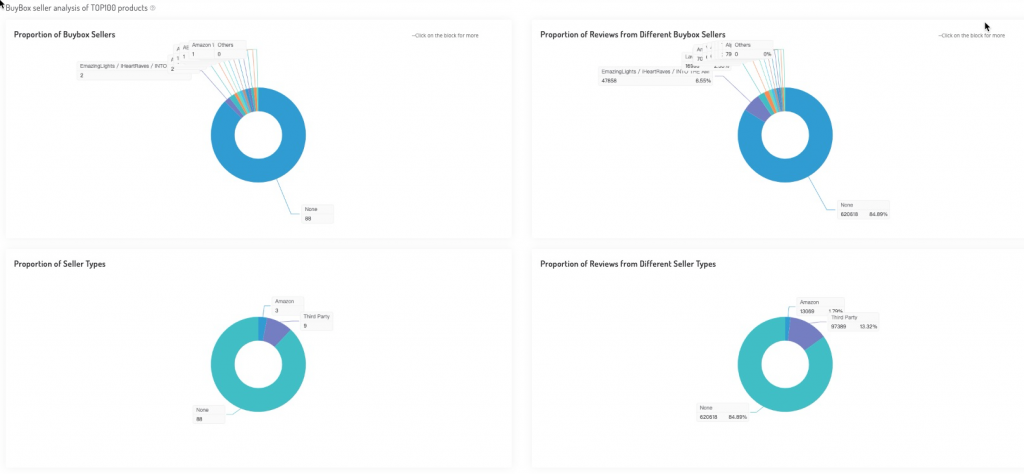
8. BuyBox Seller Analysis of TOP100 Products
From product share, review share, head store type share, head store type review share, these four aspects to analyze; by analyzing the performance of stores with BuyBox products, you can determine whether the category is monopolized by a few sellers, and then determine the development potential of new products; in addition, the smaller the share of Amazon stores, the more suitable for third-party sellers to enter.
About the ‘Competitive Analysis’ function, this issue is finished, the subsequent will still be optimized, stay tuned!